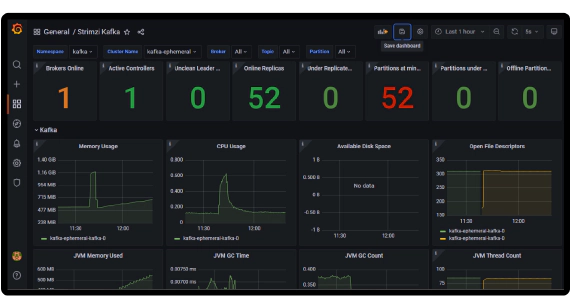
Create Apache Kafka cluster on Kubernetes using Strimzi and monitor using Prometheus, Grafana
In this article, we will see how to create an Apache Kafka cluster on Kubernetes using Strimzi and to monitor Strimzi …
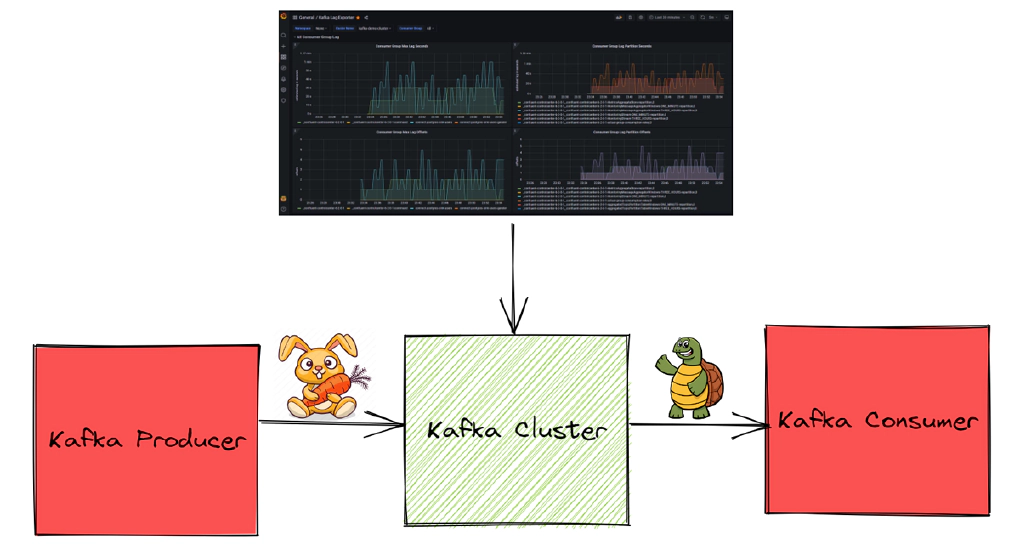

Kafka consumer lag gives the offset difference between last produced message and the last consumed message. If the rate of production is higher than the rate of consumption then consumer groups will exhibit lag. An efficient streaming application requires consumer lag to be minimal, a higher consumer lag indicates performance problems with the consumers. Managed Kafka services like Confluent Kafka, Amazon MSK come with consumer lag monitoring built using Control Center, Cloud Watch respectively. In this article, we will see a few more options to monitor Kafka consumers.
For the purpose of the demo we will use a docker container called kafka-tools which has kafkacat and Kafka binary installed.
git clone https://github.com/entechlog/kafka-examples.git
cd into kafka-examples/kafka-tools directory and start the container
cd kafka-examples/kafka-tools
docker-compose up -d --build
Validate the containers by running
docker ps
SSH into the container
docker exec -it kafka-tools /bin/bash
Validate kafkacat and connection to the Kafka cluster. This command lists all brokers in the cluster
kafkacat -L -b 192.168.0.107:39092 | grep broker
Make sure to change the broker name 192.168.0.107:39092 to Kafka broker on the next few commands which references a Kafka broker.
Validate Kafka binary and connection to the Kafka cluster. This command lists all brokers in the cluster
cd /kafka/bin/
./kafka-broker-api-versions.sh --bootstrap-server 192.168.0.107:39092 | awk '/id/{print $1}'
This is an optional step, if you don’t have a Kafka cluster, Kafka producer and a Kafka consumer you can also create one up by running below commands.
cd kafka-examples/kafka-postgres-superset
docker-compose up --remove-orphans -d --build
In the next few steps we will review a couple of options to get the Kafka consumer lag starting from simple CLI options to monitoring using Prometheus and Grafana.
Kafka ships with a script called kafka-consumer-groups.sh, which can be used to list all consumer groups, describe a consumer group, delete consumer group info, or reset consumer group offsets. Getting Kafka consumer lag using this script would be the simplest way to get the consumer lag of a consumer group.
Get the list of consumer groups and identify the consumer group for which you want to check the consumer lag
./kafka-consumer-groups.sh --bootstrap-server 192.168.0.107:39092 --list
This script is located in /kafka/bin directory of kafka-tools container
Get the consumer offsets and lag using the consumer group name identified from above list command
./kafka-consumer-groups.sh --bootstrap-server 192.168.0.107:39092 --group <consumer-group-name> --describe

This gives the lag information for a specific consumer group. Still it would be a manual effort and inefficient way to get lag when you have a few consumer groups.
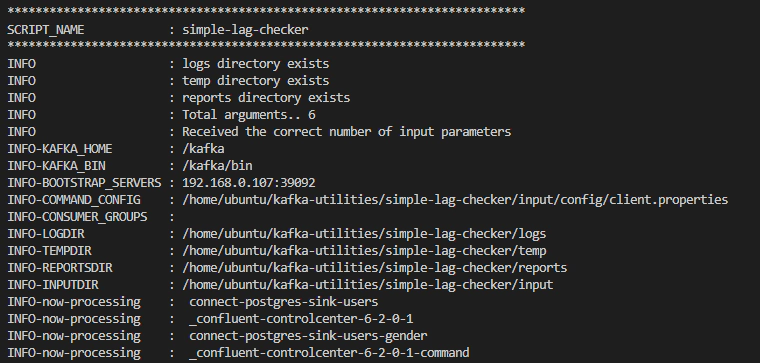
To reduce the manual effort of checking each consumer group, we will create a wrapper script simple-lag-checker.sh on top of kafka-consumer-groups.sh. This wrapper script will loop over all available consumer groups and capture the lag information in a html report.
Clone the repo kafka-utilities
git clone https://github.com/entechlog/kafka-utilities.git
cd to the directory which contains the script
cd kafka-utilities/simple-lag-checker
Here is the list of input variables accepted by simple-lag-checker.sh
| Input | Description |
|---|---|
| kafka_home | Path in which kafka is installed |
| bootstrap_servers | Kafka host and port number in host:port format |
| command_config | Full path for command config file |
| consumer_groups | Filter to fetch all consumers with matching pattern |
Execute the script by running the command
./simple-lag-checker.sh \
--kafka_home /kafka --bootstrap_servers 192.168.0.107:39092 \
--command_config /home/ubuntu/kafka-utilities/simple-lag-checker/input/config/client.properties
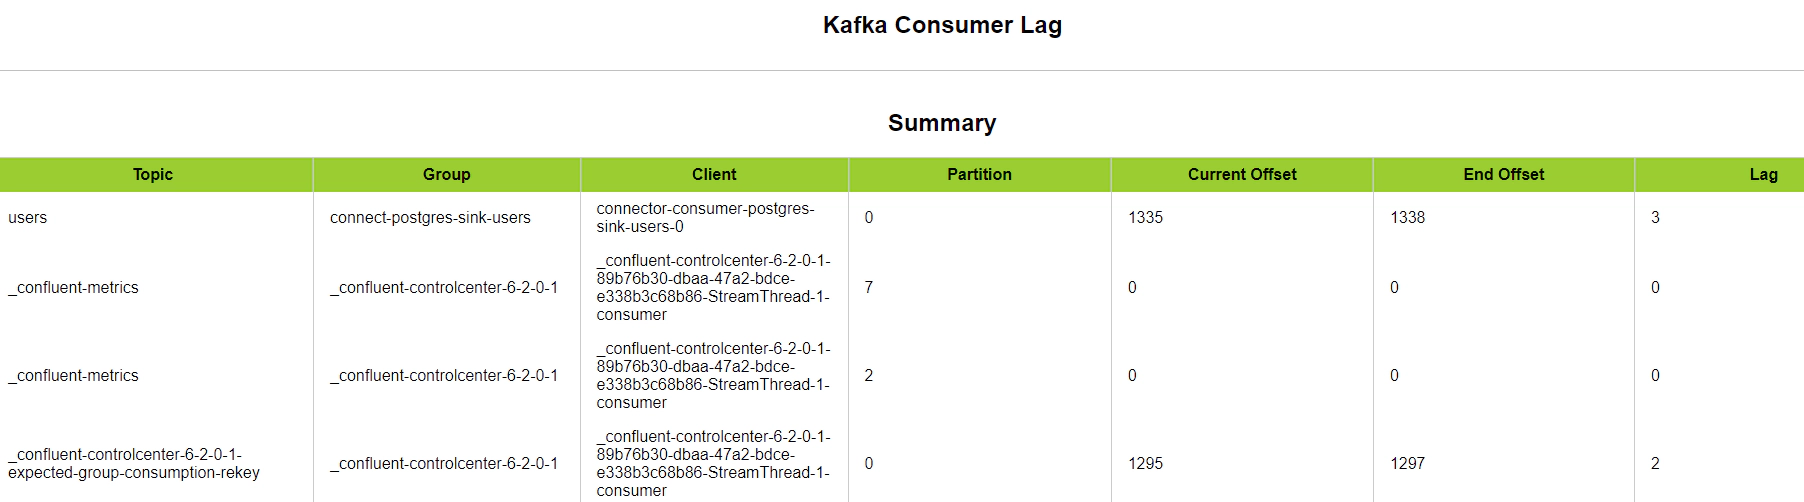
Successful execution will create reports in html and csv format inside reports directory. We will copy the report from docker to local machine for review
docker cp 59c182a8c325:/home/ubuntu/kafka-utilities/simple-lag-checker/reports/simple-lag-checker_2022_05_0105_08_23.html C:\Users\entechlog\Downloads
Here is how a report generated by this process will look like
This is a slight improvement over the previous process which helps to quickly get the Kafka consumer lag. The disadvantage of this process is, it is still a manual process.
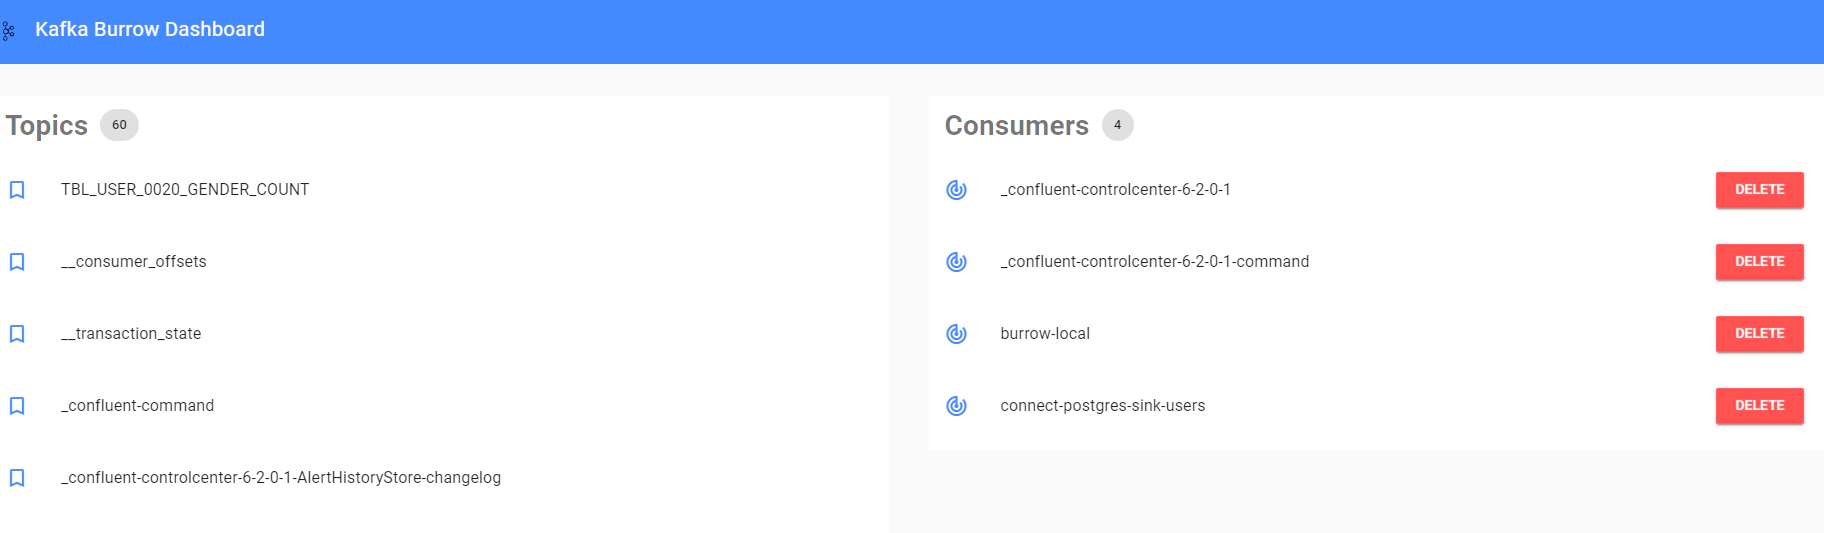
Burrow is a monitoring companion for Apache Kafka that provides consumer lag checking as a service without the need for specifying thresholds. It monitors committed offsets for all consumers and calculates the status of those consumers on demand. An HTTP endpoint is provided to request status on demand, as well as provide other Kafka cluster information. There are also configurable notifiers that can send status out via email or HTTP calls to another service.
cd to the kafka-consumer-lag directory. This will be our work directory to bring up docker containers required for this demo
cd kafka-examples\kafka-consumer-lag
Update kafka-consumer-lag\burrow\config\burrow.toml to add Kafka cluster information. See the wiki page for all supported configuration
Start Burrow containers
docker-compose -f docker-compose-burrow.yml up -d --build
Navigate to Burrow Dashboard to see the consumer details
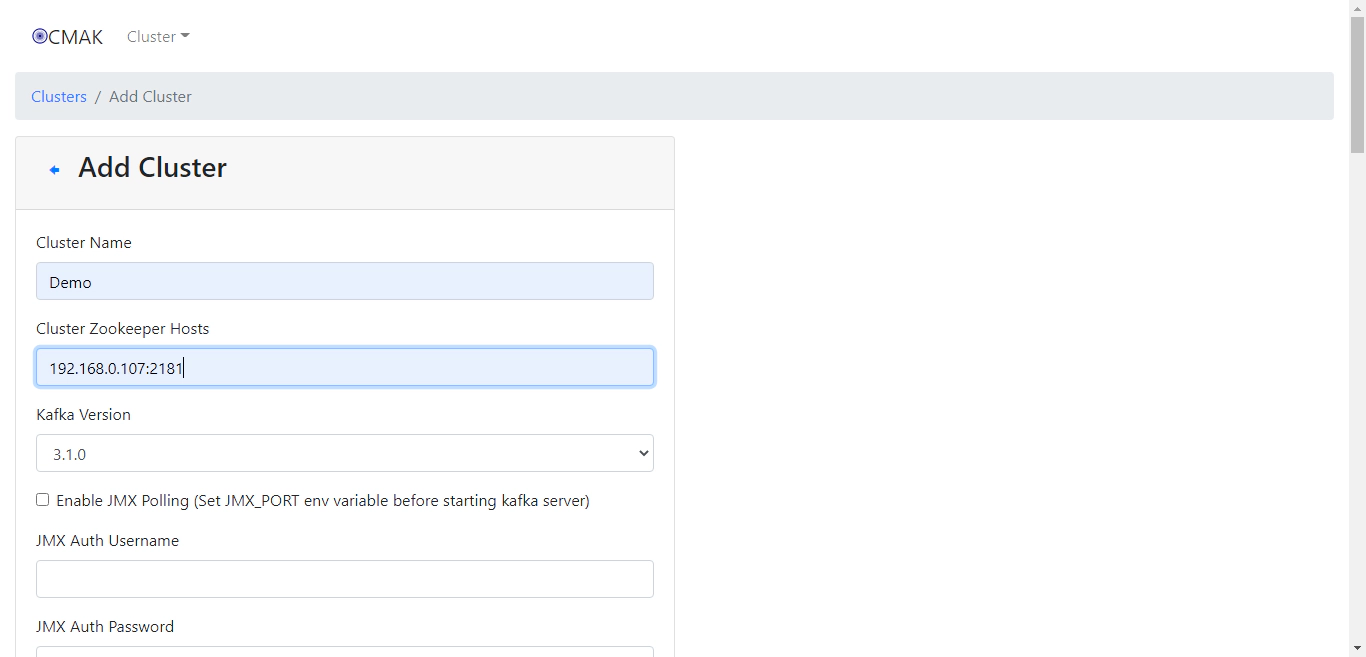
CMAK (previously known as Kafka Manager) is a tool for managing Apache Kafka clusters. CMAK helps to manage Kafka clusters, inspect cluster state like topics, consumers, offsets, brokers, replica distribution, partition distribution. Though the primary function of CMAK is to manage the Kafka clusters, it can be also used to visualize Kafka consumer lag and other important Kafka metrics.
Update kafka-consumer-lag\ymck\config\consumer.properties to add Kafka broker information
Update ZK_HOSTS in “docker-compose-ymck.yml” to add your zookeeper information. You can also comment “extra_hosts” information if you don’t have a need for hostname mapping
Start CMAK containers
docker-compose -f docker-compose-ymck.yml up -d --build
Navigate to CMAK Dashboard to add the Kafka cluster details and enable “Poll consumer information”
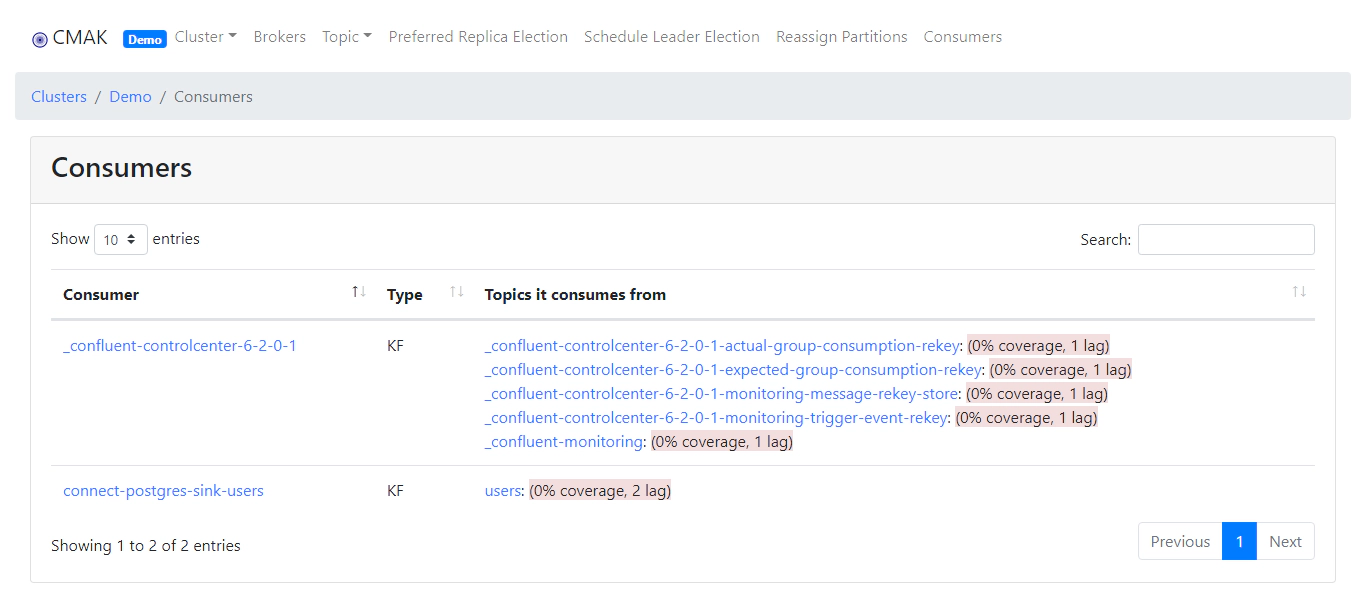
After adding the Kafka cluster details, Navigate to Consumers tab to view the Kafka consumer lag information
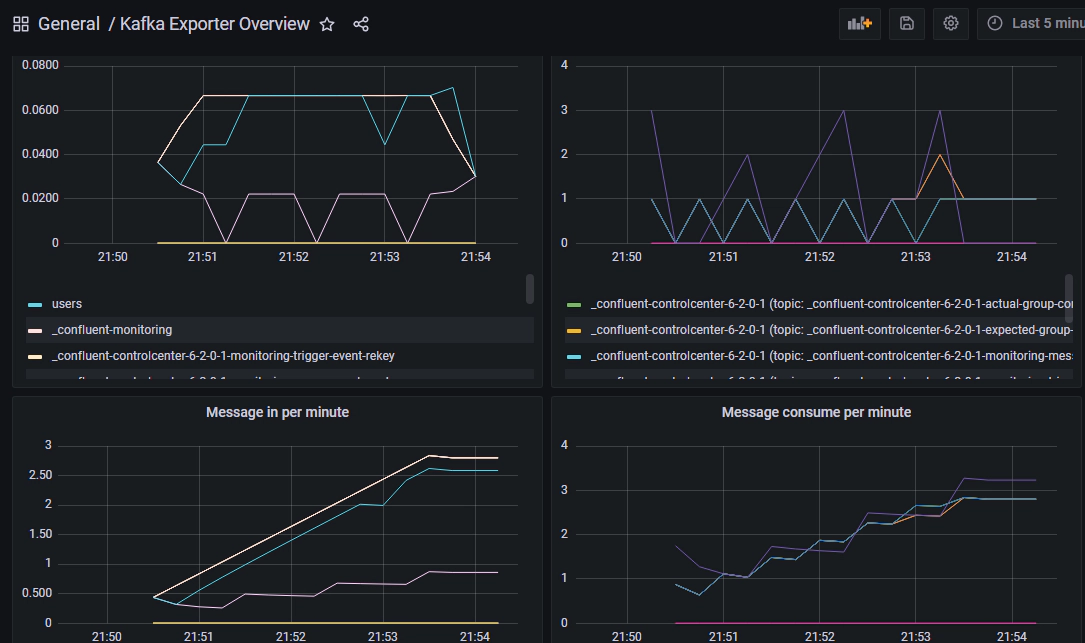
Kafka exporter for Prometheus, exposes brokers, topics and consumer groups metrics. See here for details exposed by Kafka exporter.
Update Kafka broker information in “docker-compose-kafka-exporter.yml”
Start the Kafka exporter, Prometheus and Grafana containers
docker-compose -f docker-compose-kafka-exporter.yml up -d --build
Navigate to Grafana Dashboard and select Kafka Exporter Overview dashboard
Monitor Kafka Consumer Group Latency with Kafka Lag Exporter. Kafka Lag Exporter provides features to run easily on Docker and Kubernetes clusters. We will see how to run it in Docker and Kubernetes along with Prometheus and Grafana.
Update kafka-consumer-lag\kafka-lag-exporter\application.conf to add Kafka cluster. Here is an example configuration
kafka-lag-exporter {
  reporters.prometheus.port = 8000
  poll-interval = 30 seconds
  clusters = [
    {
      name = "kafka-demo-cluster"
      bootstrap-brokers = "192.168.0.107:39092"
      consumer-properties = {
        security.protocol = "PLAINTEXT"
      }
      admin-client-properties = {
        security.protocol = "PLAINTEXT"
      }
    }
  ]
}
See here for all supported configuration for kafka-lag-exporter
Start Kafka lag exporter, Prometheus and Grafana containers
docker-compose -f docker-compose-kafka-lag-exporter.yml up -d --build
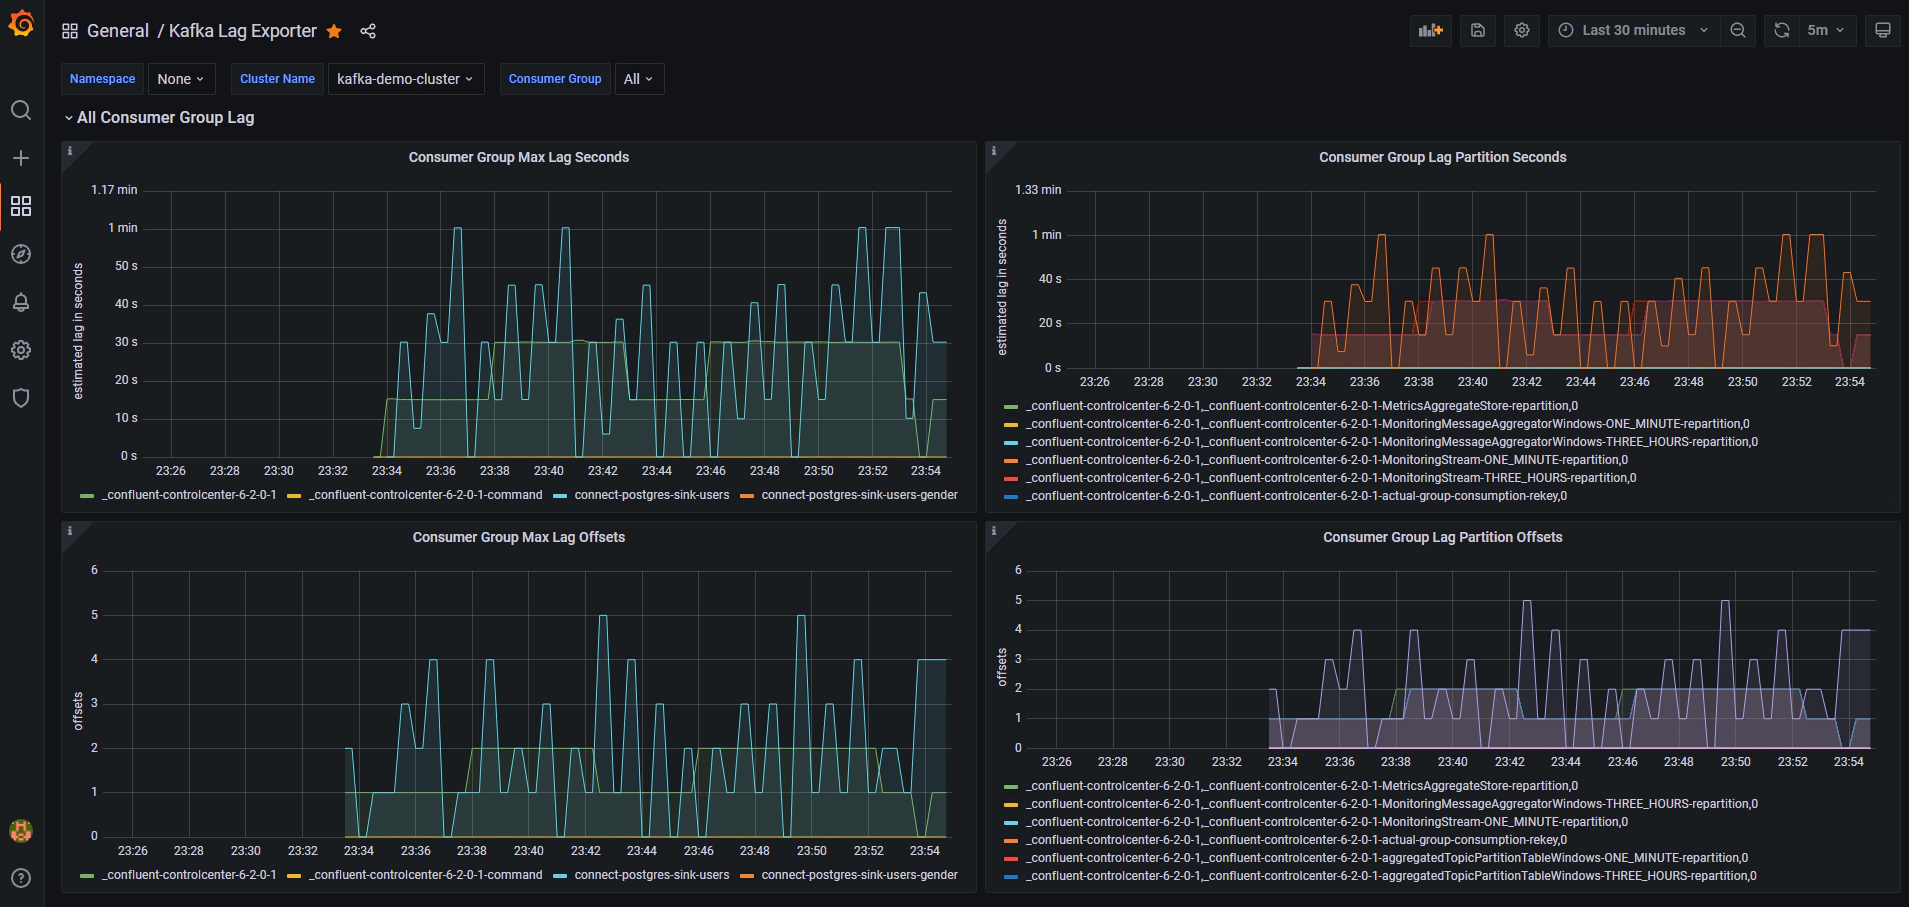
Navigate to Grafana Dashboard and select Kafka Lag Exporter dashboard. This should give a neat view of consumer lag by time and offset
The best part of Kafka Lag Exporter is it can deployed in Kubernetes, Here is a quick run down on how to install Kafka Lag Exporter in Kubernetes
Add the chart repository for kafka-lag-exporter
helm repo add kafka-lag-exporter https://seglo.github.io/kafka-lag-exporter/repo/
Update information of available charts locally from chart repositories
helm repo update
List and verify the chart repository
helm repo list
Create values.yml file based on your use case, See here for a sample file with detailed explanation for each of the configuration. You can change service type in this as well
Do a dry run install to verify the generated yaml file
helm install kafka-lag-exporter \
kafka-lag-exporter/kafka-lag-exporter \
--namespace kafka --dry-run --debug \
-f kafka-lag-exporter/lag-exporter-values.yml
Do actual install by running below command
helm install kafka-lag-exporter \
kafka-lag-exporter/kafka-lag-exporter \
--namespace kafka \
-f kafka-lag-exporter/lag-exporter-values.yml
If you used ClusterIP you can access the metric endpoint following below steps
kubectl port-forward service/kafka-lag-exporter-service 8000:8000 --namespace kafka
# Navigate to below endpoint in your browser
http://127.0.0.1:8000
If you used NodePort you can access the metric endpoint following below steps
export NODE_PORT=$(kubectl get --namespace kafka -o jsonpath="{.spec.ports[0].nodePort}" services kafka-lag-exporter-service)
export NODE_IP=$(kubectl get nodes --namespace kafka -o jsonpath="{.items[0].status.addresses[0].address}")
echo http://$NODE_IP:$NODE_PORT
# Navigate to the endpoint from above echo
# If you use Kubernetes in Docker then use localhost:NODEPORT to access the endpoint like `http://localhost:30072/`
If the endpoint is operational you can add it to Prometheus target. If you don’t have a Prometheus target for demo create one quickly by running below docker-compose from kafka-examples
docker-compose -f docker-compose-kafka-lag-exporter-kube.yml up -d --build
Once deployed in Kubernetes OR as an application Kafka Lag Exporter provides a way to always monitor the consumer lag and send alerts when certain limits are reached.
UI for Apache Kafka is a free, open-source web UI to monitor and manage Apache Kafka clusters. Its lightweight dashboard makes it easy to track key metrics of your Kafka clusters - Brokers, Topics, Partitions, Production, and Consumption.
Update docker-compose-kafka-ui.yml to add your Kafka cluster details. Here is an example configuration
    environment:
      - KAFKA_CLUSTERS_0_NAME=kube-cluster
      - KAFKA_CLUSTERS_0_BOOTSTRAPSERVERS=192.168.0.101:30020
      - KAFKA_CLUSTERS_0_READONLY=true
You can add more the one cluster by adding more environment like KAFKA_CLUSTERS_1, KAFKA_CLUSTERS_2, etc
Start UI for Apache Kafka
docker-compose -f docker-compose-kafka-ui.yml up -d --build
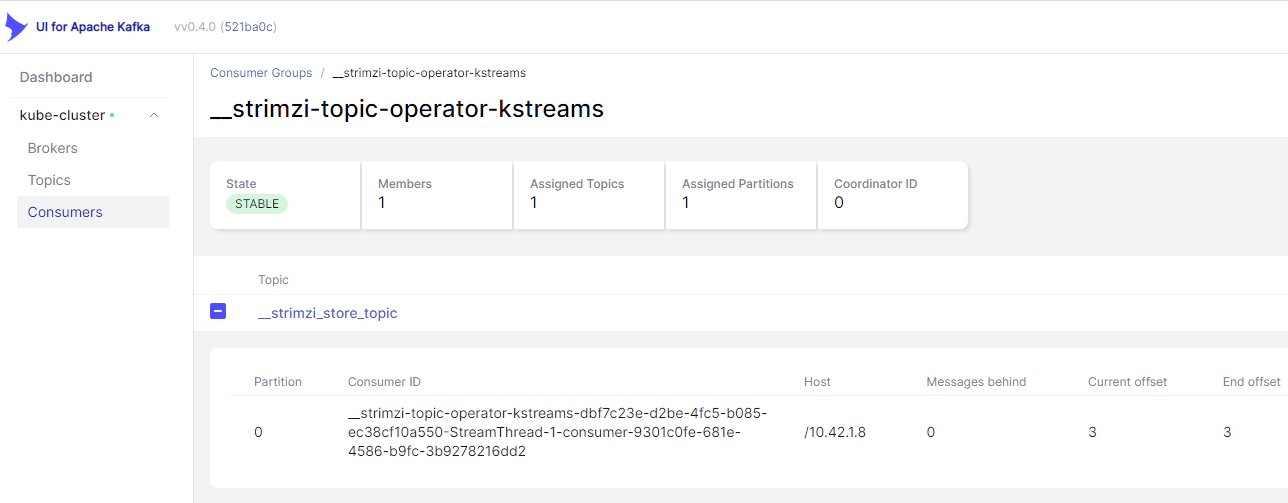
Navigate to UI for Apache Kafka and click Consumers to view the Kafka consumer details
Getting visibility into Kafka consumer lag will help to decide the next operational task on fixing the lag by tuning the consumer properties, increasing the number of Kafka partitions, and adding additional consumers to your consumer group are few of the potential actions which you could take.
Run the below command to delete the docker containers and related volumes.
## Kafka tools
cd kafka-examples\kafka-tools
docker-compose down -v --remove-orphans --rmi all
## Burrow
cd kafka-examples\kafka-consumer-lag
docker-compose -f docker-compose-burrow.yml down -v --remove-orphans --rmi
## YMCK
docker-compose -f docker-compose-ymck.yml down -v --remove-orphans --rmi
## Kafka Exporter
docker-compose -f docker-compose-kafka-exporter.yml down -v --remove-orphans --rmi
## Kafka Lag Exporter
docker-compose -f docker-compose-kafka-lag-exporter.yml down -v --remove-orphans --rmi
docker-compose -f docker-compose-kafka-lag-exporter-kube.yml down -v --remove-orphans --rmi
## UI for Apache Kafka
docker-compose -f docker-compose-kafka-ui.yml down -v --remove-orphans --rmi
You can list and delete the helm deployments after the demo by running below command
helm list

helm delete kafka-lag-exporter --namespace kafka
Hope this was helpful. Did I miss something ? Let me know in the comments.
In this article, we will see how to create an Apache Kafka cluster on Kubernetes using Strimzi and to monitor Strimzi …
In this article, we will see how to use Aiven’s GCS Sink Connector for Apache Kafka to stream data from Kafka to …