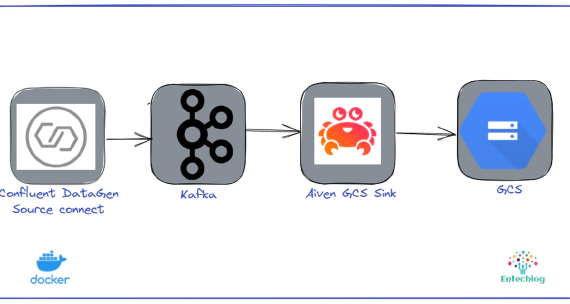
Stream data from Kafka to Google Cloud Storage(GCS) using Aiven's GCS Sink Connector
In this article, we will see how to use Aiven’s GCS Sink Connector for Apache Kafka to stream data from Kafka to …

In this article, we will see how to create an Apache Kafka cluster on Kubernetes using Strimzi and to monitor Strimzi deployment using Prometheus and Grafana. Strimzi provides a way to run an Apache Kafka cluster on Kubernetes in various deployment configurations.
For the purpose of the demo we will use a docker container called kube-tools which has kubectl installed
Open a new terminal and cd into kube-tools directory and start container.
cd kube-tools
docker-compose up -d --build
Validate the containers by running
docker ps
SSH into the container
docker exec -it kube-tools /bin/bash
Download and setup KUBECONFIG env variable
mkdir -p ~/.kube && scp ubuntu@192.168.0.100:~/.kube/config ~/.kube/config
export KUBECONFIG=~/.kube/config
Validate kubectl
kubectl version
In the next few steps we start the Kafka cluster on Kubernetes using Strimzi. These steps are executed inside the docker container, kubernetes-examples directory. This directory has all required manifest files and example configurations to set up the cluster mostly sourced from official Strimzi examples repo but also customized a bit for this demonstration.
Create namespace for kafka
kubectl apply -f strimzi/kafka/kafka-namespace.yaml
Alternate command kubectl create namespace kafka
Verify namespace
kubectl get ns
Alternate command kubectl get namespace
Set context, so we can run the next set of commands without specifying namespace. If you ever change the context please remember set it back to kafka by running this command OR by specifying namespace by adding “-n kafka” to the command itself
kubectl config set-context --current --namespace=kafka
Download strimzi-x.y.z.zip from GitHub and unzip contents inside kubernetes-examples/strimzi directory.
Version used for this demo is 0.28.0 and the unzip directory name is strimzi-0.28.0
Update the namespace in role RoleBinding manifest file
sed -i 's/namespace: .*/namespace: kafka/' \
strimzi/strimzi-0.28.0/install/cluster-operator/*RoleBinding*.yaml
Install strimzi-cluster-operator
kubectl apply -f strimzi/strimzi-0.28.0/install/cluster-operator/
Verify the strimzi-cluster-operator
kubectl get all
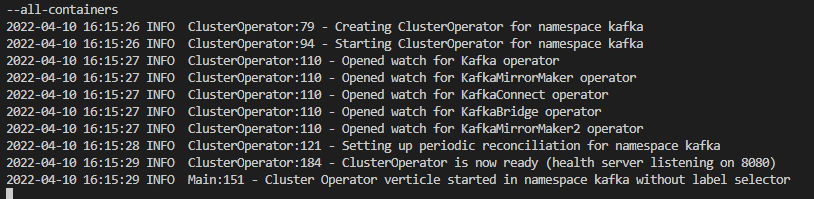
Verify the logs of strimzi-cluster-operator
kubectl logs -f -l name=strimzi-cluster-operator --all-containers
Verify the CustomResourceDefinition(crd)
kubectl get crd | grep strimzi
kubectl apply -f strimzi/kafka/kafka-clusterrolebindings.yaml
kubectl get clusterrole | grep strimzi
Create the Kafka cluster. This is a slightly customized version of kafka-ephemeral.yaml to include metrics exporter as well
kubectl apply -f strimzi/kafka/kafka-ephemeral.yaml
Verify the Kafka cluster. This would take a bit to come up
kubectl get kafka
kubectl logs -f -l app.kubernetes.io/instance=kafka-ephemeral --all-containers --max-log-requests 10
kubectl wait kafka/kafka-ephemeral --for=condition=Ready --timeout=300s
Verify the Kafka cluster status
kubectl get kafka kafka-ephemeral -o yaml
In the next few steps we start Prometheus on Kubernetes and configure to scrape the required metrics from Kafka resources using example configurations from Strimzi.
Download prometheus-operator, update namespace to kafka and save in our workspace
curl -s \
https://raw.githubusercontent.com/prometheus-operator/prometheus-operator/release-0.50/bundle.yaml \
| sed -e 's/namespace: default/namespace: kafka/' > strimzi/prometheus/prometheus-operator-deployment.yaml
Create prometheus-operator CustomResourceDefinition(crd)
kubectl apply -f strimzi/prometheus/prometheus-operator-deployment.yaml
Create scrape configuration Secret
cp strimzi/strimzi-0.28.0/examples/metrics/prometheus-additional-properties/prometheus-additional.yaml \
strimzi/prometheus/prometheus-additional.yaml

kubectl apply -f strimzi/prometheus/prometheus-additional.yaml
Create PodMonitor. Make sure to update matchNames: to the namespace kafka
cat strimzi/strimzi-0.28.0/examples/metrics/prometheus-install/strimzi-pod-monitor.yaml \
| sed -e 's/- myproject/- kafka/' > strimzi/prometheus/strimzi-pod-monitor.yaml

kubectl apply -f strimzi/prometheus/strimzi-pod-monitor.yaml
Create PrometheusRule
cp strimzi/strimzi-0.28.0/examples/metrics/prometheus-install/prometheus-rules.yaml \
strimzi/prometheus/prometheus-rules.yaml

kubectl apply -f strimzi/prometheus/prometheus-rules.yaml
namespace: to the namespace kafkacat strimzi/strimzi-0.28.0/examples/metrics/prometheus-install/prometheus.yaml \
| sed -e 's/namespace: myproject/namespace: kafka/' > strimzi/prometheus/prometheus.yaml
kubectl apply -f strimzi/prometheus/prometheus.yaml
Validate Strimzi metrics
kubectl get pods|grep exporter
kubectl port-forward deployment/kafka-ephemeral-kafka-exporter 9404:9404
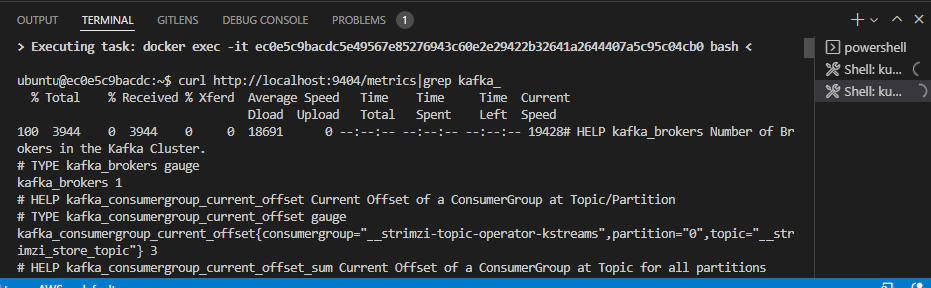
# Open a new terminal of kube-tools container and run to make sure we have metrics
curl http://localhost:9404/metrics|grep kafka_
Install Grafana using modified version of grafana.yaml named “grafana-load-balancer.yaml”. Adding LoadBalancer will help to expose the service outside kubernetes
kubectl apply -f strimzi/grafana/grafana-load-balancer.yaml
Get the services to see the port number for Grafana
kubectl get svc
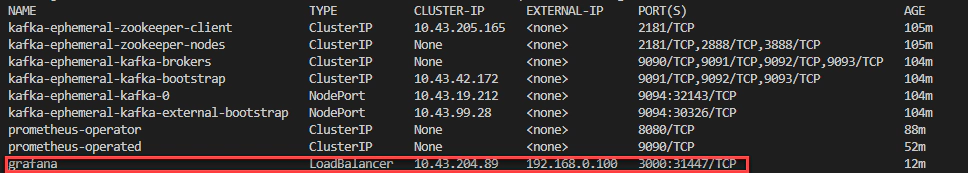
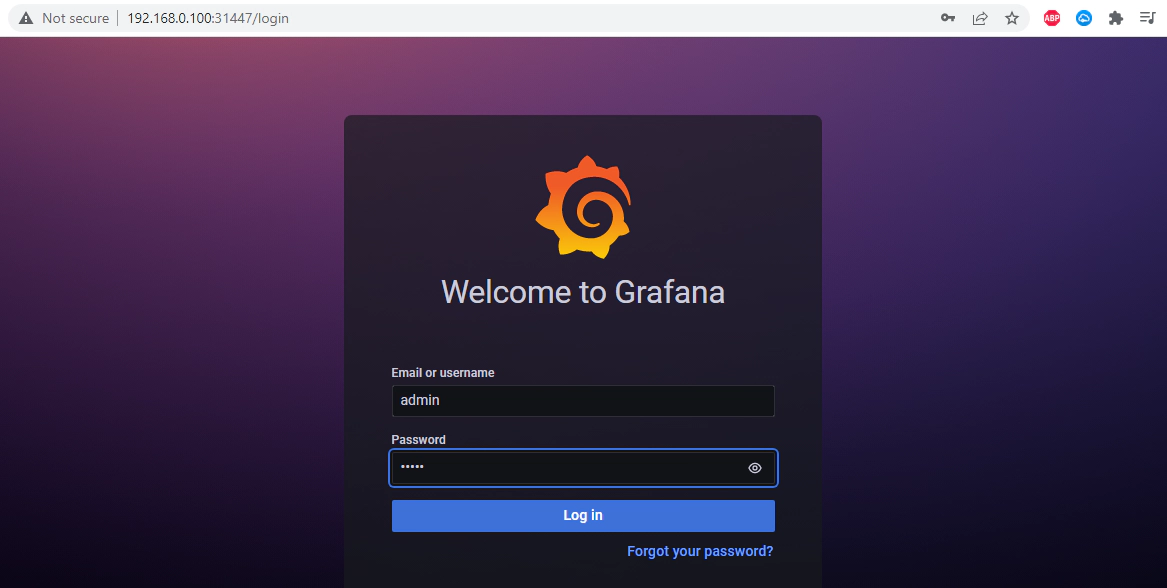
Navigate to Grafana UI using the IP address/port of the Grafana service. Login using default credential of admin/admin, after the login you will be also given the option to change the default credential
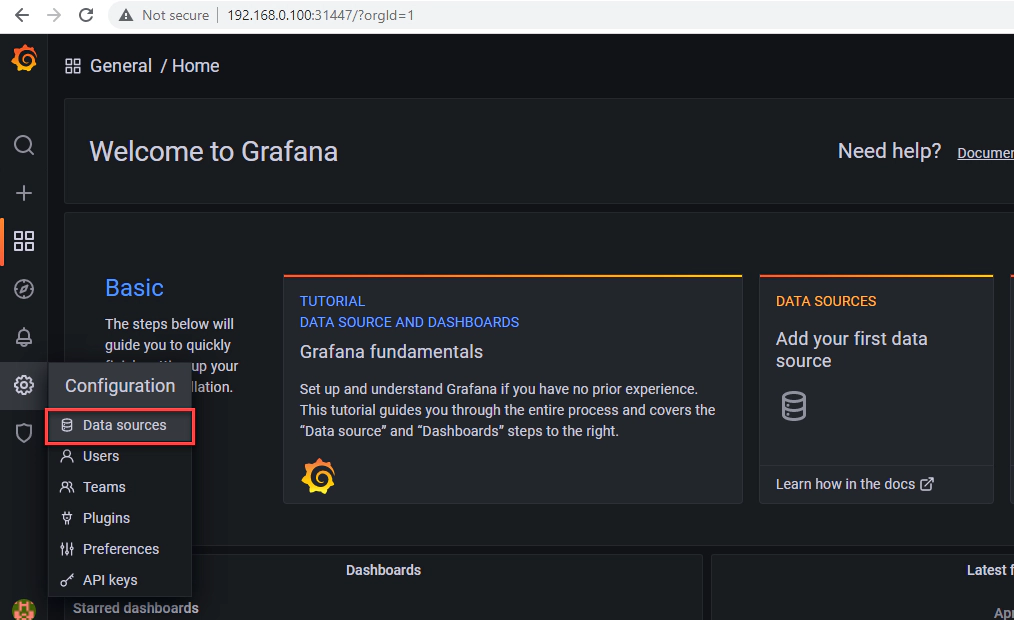
Navigate to Configuration –> Data sources
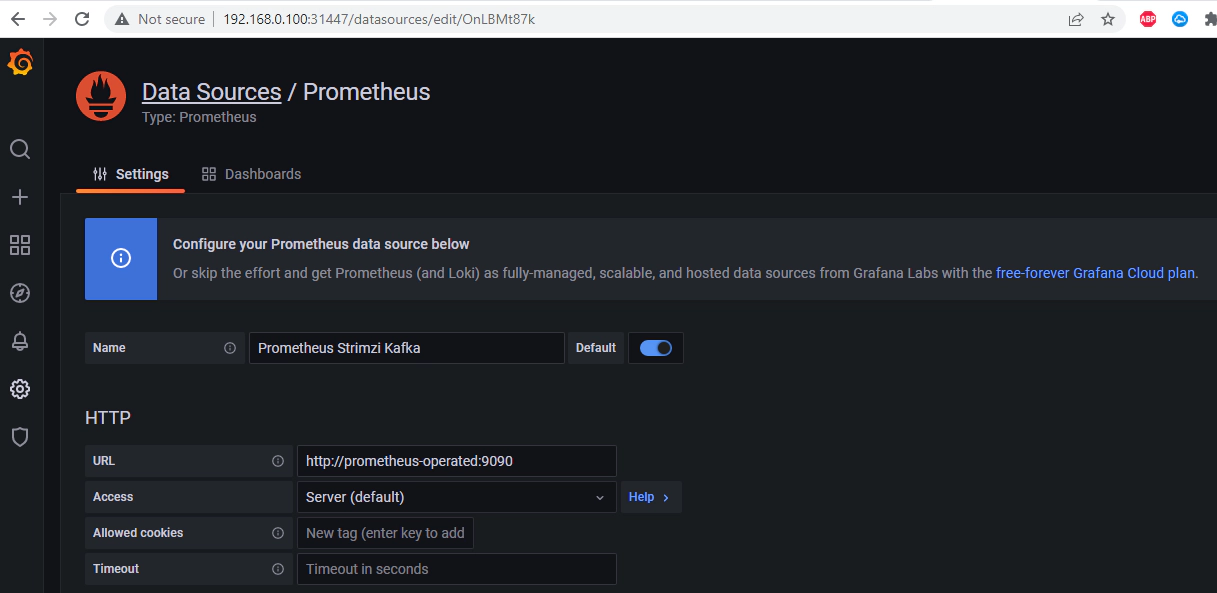
The endpoint for the kafka metrics data source is http://prometheus-operated:9090, you can get this information from kubectl get svc
Navigate to Create –> Import
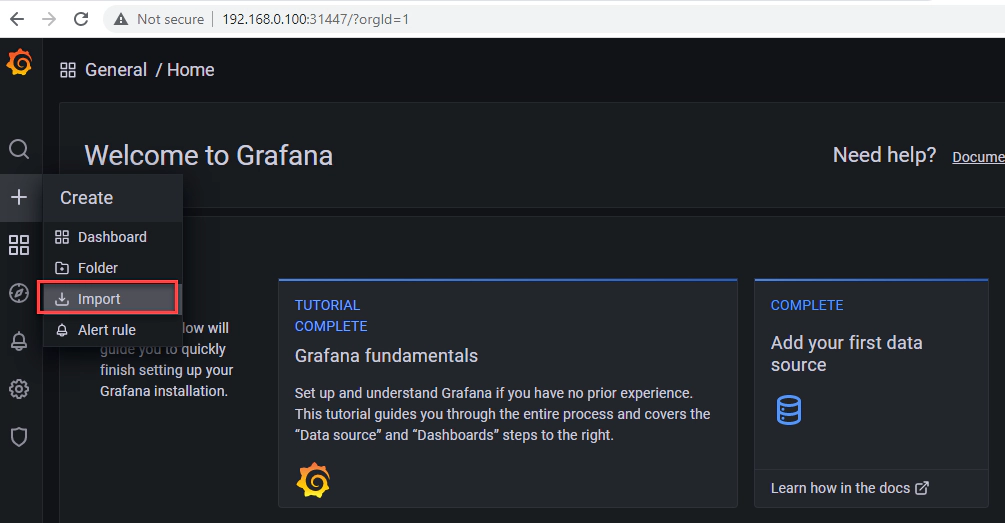
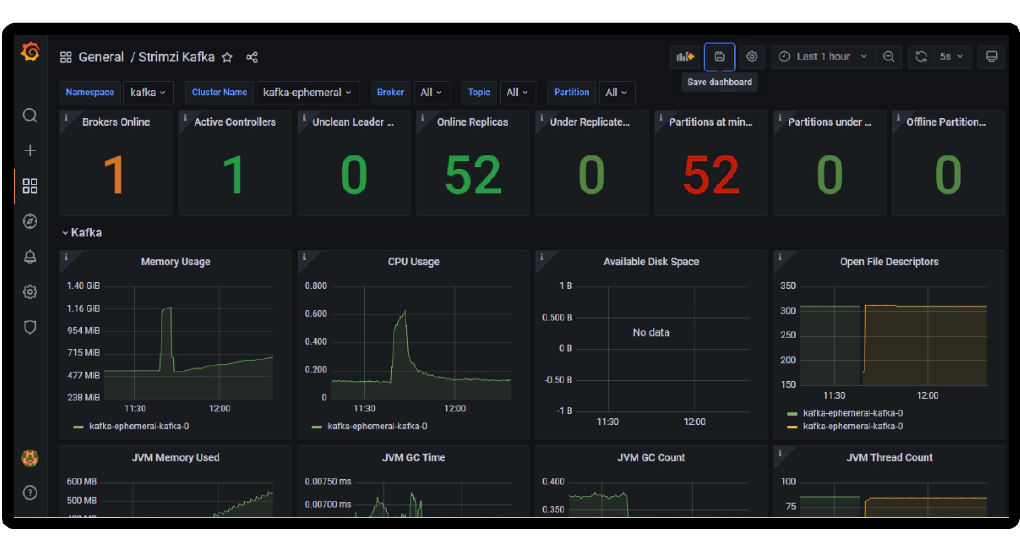
Import the example dashboard from Strimzi
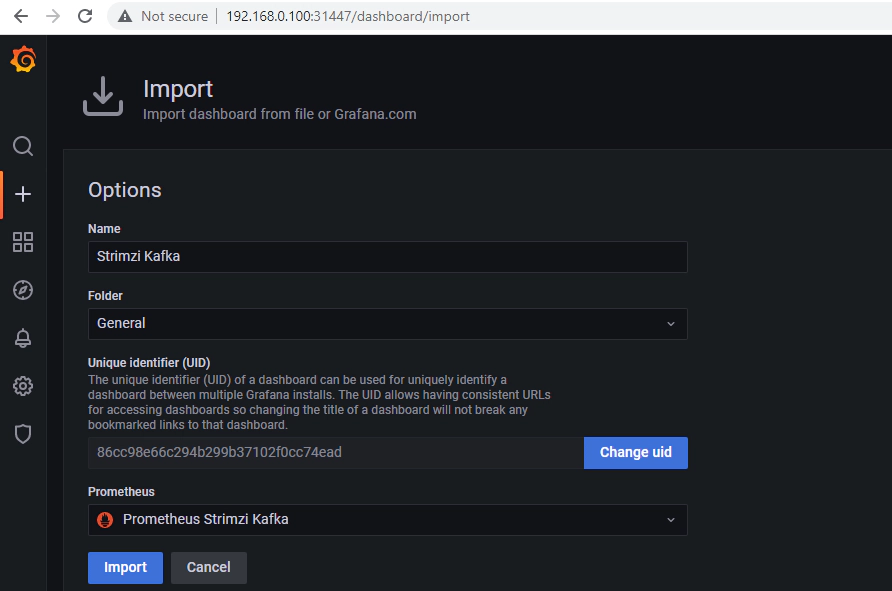
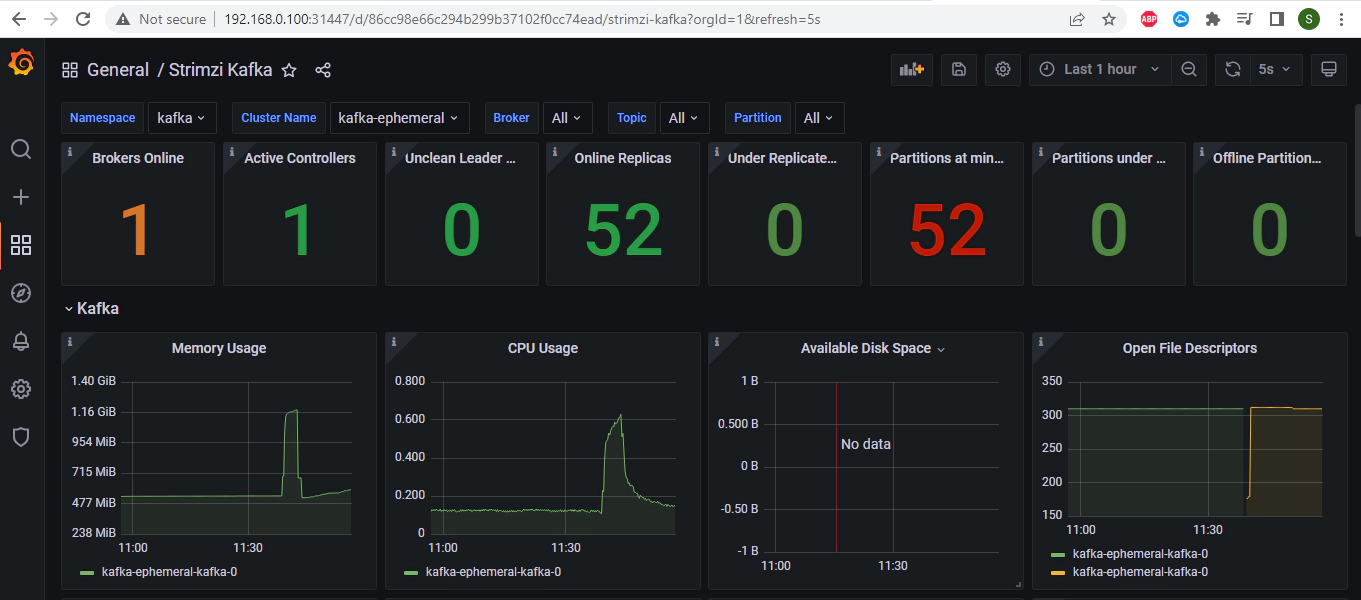
You can see the dashboard with Kafka metics in the imported dashboard
In this demo we configured the external access using node ports. You can also use Load Balancers provided you have the necessary resources to provision load balancer.
Get the node port number of the external bootstrap service
kubectl get service kafka-ephemeral-kafka-external-bootstrap -o=jsonpath='{.spec.ports[0].nodePort}{"\n"}'
Get the nodes in your cluster
kubectl get nodes
Get the address of one of the nodes in your Kubernetes cluster
kubectl get node pi-kube-n1 -o=jsonpath='{range .status.addresses[*]}{.type}{"\t"}{.address}{"\n"}'
Using the address and port we can access the Kafka outside of Kubernetes. Here is an example command
kafkacat -L -b 192.168.0.101:31806
To remove all Kubernetes resources run the script. This script deletes all resources in reverse order on how it was created
./strimzi/scripts/delete-all.sh
Sometime there could be hung resource and it could take a few minutes for cleanups to finish, If you are in hurry run below command to force delete the resources
kubectl delete all --all --grace-period=0 --force -n kafka
Open a new terminal and cd into kube-tools directory. Run the below command to delete the docker containers and related volumes
docker-compose down -v --remove-orphans
The configuration used here is only for demonstration purposes only. Strimzi can be configured for production environments by customizing further, see official Configuring Strimzi for more details.
Hope this was helpful. Did I miss something ? Let me know in the comments.
In this article, we will see how to use Aiven’s GCS Sink Connector for Apache Kafka to stream data from Kafka to …
In this article, we will see how to install and configure Kubernetes cluster in Raspberry Pi. Docker, Ansible, k3s and …