
Exploring ksqlDB in Docker, headless ksqlDB and ksqlDB in Kubernetes
ksqlDB is built on top of Kafka Streams, a lightweight, powerful Java library for enriching, transforming, and …

In this article, we will see how to use elk in Docker with the help of logs from Pi-hole. Code used in this article can be found at here
Step 1: Create a user
sudo useradd -m elkuser
Step 2: Set password for the user
sudo passwd elkuser
Step 1: Install OpenSSH server
sudo apt update
sudo apt upgrade
sudo apt install openssh-server
Step 2: Generate RSA key pair on your local computer
ssh-keygen
192.168.1.16 entechlog-vm-04
Step 3: Copy Public SSH Key to target machines
I had to run ssh-keygen -R entechlog-vm-04 to remove some old hosts
On machines with ssh-copy-id run
ssh-copy-id elkuser@entechlog-vm-04
OR
On machines without ssh-copy-id
cat ~/.ssh/id_rsa.pub | ssh elkuser@entechlog-vm-04 "mkdir -p ~/.ssh && cat >> ~/.ssh/authorized_keys"
Step 1: Install SSHFS Client in Linux Systems
yum install sshfs
dnf install sshfs              [On Fedora 22+ releases]
sudo apt-get install sshfs     [On Debian/Ubuntu based systems]
Step 2: Creating SSHFS Mount Directory
mkdir -p /mnt/entechlog/pihole/var/log
sudo mkdir -p /mnt/entechlog/pihole/var/log     [On Debian/Ubuntu based systems]
Step 3: Mounting Remote Filesystem with SSHFS
sshfs elkuser@entechlog-vm-04:/var/log/ /mnt/entechlog/pihole/var/log
sudo sshfs -o allow_other elkuser@entechlog-vm-04:/var/log/ /mnt/entechlog/pihole/var/log     [On Debian/Ubuntu based systems]
Step 4: Verifying Remote Filesystem is Mounted
cd /mnt/entechlog/pihole/var/log
ls -ltra | grep pihole

drwxr-xr-x 1      999      995     4096 May 30 17:30 pihole
-rw-r--r-- 1      999      995  1179041 Sep  2 00:00 pihole.log.5.gz
-rw-r--r-- 1      999      995  1605930 Sep  3 00:00 pihole.log.4.gz
-rw-r--r-- 1      999      995   910864 Sep  4 00:00 pihole.log.3.gz
-rw-r--r-- 1      999      995      320 Sep  4 00:00 pihole-FTL.log.3.gz
-rw-r--r-- 1      999      995   912228 Sep  5 00:00 pihole.log.2.gz
-rw-r--r-- 1      999      995      283 Sep  5 00:00 pihole-FTL.log.2.gz
-rw-r--r-- 1      999      995 19780372 Sep  6 00:00 pihole.log.1
-rw-r--r-- 1      999      995      840 Sep  6 00:00 pihole-FTL.log.1
-rw-r--r-- 1 root     root         1448 Sep  6 04:27 pihole_updateGravity.log
-rw-r--r-- 1      999      995     3296 Sep  6 22:13 pihole-FTL.log
-rw-r--r-- 1      999      995 34797579 Sep  6 22:23 pihole.log
df -hT

tmpfs                                 tmpfs       1.6G     0  1.6G   0% /run/user/131
tmpfs                                 tmpfs       1.6G     0  1.6G   0% /run/user/1000
tmpfs                                 tmpfs       1.6G   16K  1.6G   1% /run/user/121
elkuser@entechlog-vm-04:/var/log/ fuse.sshfs  121G  7.3G  108G   7% /mnt/entechlog/pihole/var/log
Step 5: Mounting Remote Filesystem Permanently
nano /etc/fstab
sudo nano /etc/fstab     [On Debian/Ubuntu based systems]

sshfs#elkuser@entechlog-vm-04:/var/log/ /mnt/entechlog/pihole/var/log fuse.sshfs defaults 0 0
Step 6: Update the fstab file to reflect the changes
mount -a
sudo mount -a   [On Debian/Ubuntu based systems]
To unmount remote filesystem umount /mnt/entechlog/pihole/var/log
Step 1: Create filebeat.yml, This is to configure file beat to send the pi-hole logs to log stash
filebeat.modules:
- module: logstash

filebeat.inputs:
- type: log
  enabled: true
  paths:
    - /mnt/entechlog/pihole/var/log/pihole.log

name: elk-pihole

output.logstash:
  enabled: true
  hosts: ["ls01:5044"]

processors:
  - add_tags:
      tags: [pihole]
Step 2: Create logstash.yml and 10-pihole.conf file. Here we are routing the incoming logs to elastic search.
input {
      beats {
      port => 5044
      type => "logs"
      tags => ["pihole","5044"]
      }
}

output {
#       stdout { codec => rubydebug }
        if "pihole" in [tags]{
                elasticsearch {
                        hosts => ["es01:9200"]
                        manage_template => false
                        index => "pihole-logstash-%{+YYYY.MM}"
                }
        }
}
http.host: "0.0.0.0"
xpack.monitoring.elasticsearch.hosts: [ "http://es01:9200" ]
Step 3: Create docker-compose.yml file. This will bring up Elasticsearch, Kibana, Logstash, Filebeat.
version: '2.2'
services:
  es01:
    image: docker.elastic.co/elasticsearch/elasticsearch:7.9.1
    container_name: es01
    environment:
      - node.name=es01
      - cluster.name=es-docker-cluster
      - cluster.initial_master_nodes=es01
      - bootstrap.memory_lock=true
      - "ES_JAVA_OPTS=-Xms512m -Xmx512m"
    ulimits:
      memlock:
        soft: -1
        hard: -1
    volumes:
      - data01:/usr/share/elasticsearch/data
    ports:
      - 9200:9200
    networks:
      - elastic

  kib01:
    image: docker.elastic.co/kibana/kibana:7.9.1
    container_name: kib01
    ports:
      - 5601:5601
    environment:
      ELASTICSEARCH_URL: http://es01:9200
      ELASTICSEARCH_HOSTS: http://es01:9200
    networks:
      - elastic

  ls01:
    image: docker.elastic.co/logstash/logstash:7.9.1
    container_name: ls01
    volumes:
      - data04:/usr/share/logstash/data
      - './logstash/conf.d/10-pihole.conf:/usr/share/logstash/pipeline/logstash.conf'
      - './logstash/logstash.yml:/usr/share/logstash/config/logstash.yml:ro'
    ports:
      - 5000:5000/tcp
      - 5000:5000/udp
      - 9600:9600
    environment:
      ELASTICSEARCH_URL: http://es01:9200
      ELASTICSEARCH_HOSTS: http://es01:9200
    networks:
      - elastic

  fb01:
    image: docker.elastic.co/beats/filebeat:7.9.1
    container_name: fb01
    user: root
    environment:
      ELASTICSEARCH_URL: http://es01:9200
      ELASTICSEARCH_HOSTS: http://es01:9200
      KIBANA_HOST: http://kib01:5601
    volumes:
      - data05:/usr/share/filebeat/data
      - '/mnt/entechlog/pihole/var/log/:/mnt/entechlog/pihole/var/log/'
      - './filebeat/filebeat.yml:/usr/share/filebeat/filebeat.yml:rw'
    networks:
      - elastic

volumes:
  data01:
    driver: local
  data02:
    driver: local
  data03:
    driver: local
  data04:
    driver: local
  data05:
    driver: local

networks:
  elastic:
    driver: bridge
Step 4: Place the files in a folder with below structure
.
├── docker-compose.yml
├── filebeat
│   └── filebeat.yml
└── logstash
    ├── conf.d
    │   └── 10-pihole.conf
    └── logstash.yml
Step 5: Navigate to the folder and run docker-compose
docker-compose up
Step 1: Validate the Elasticsearch node by running curl -X GET "localhost:9200/_cat/nodes?v&pretty"
ip         heap.percent ram.percent cpu load_1m load_5m load_15m node.role master name
172.22.0.4           65          98  19    0.65    0.58     0.60 dilmrt    *      es01
Step 2: Validate the Filebeat node by running sudo docker exec -it fb01 filebeat test output
logstash: ls01:5044...
  connection...
    parse host... OK
    dns lookup... OK
    addresses: 172.22.0.3
    dial up... OK
  TLS... WARN secure connection disabled
  talk to server... OK
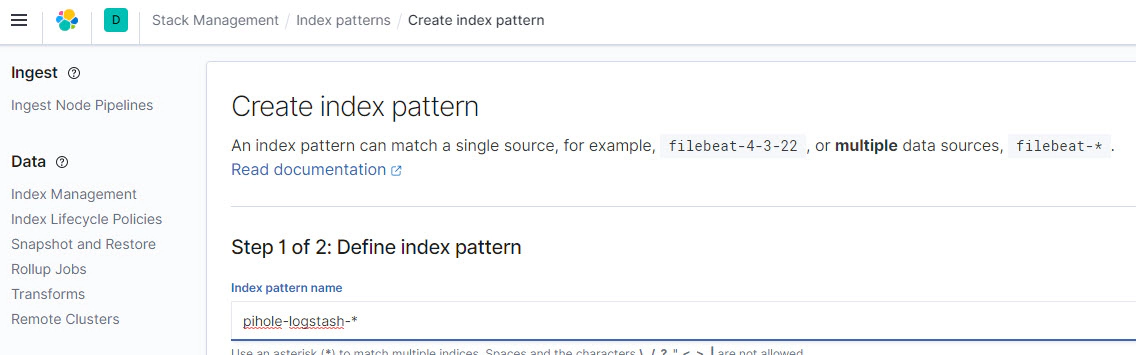
Step 3: Navigate to Kibana http://entechlog-vm-01:5601/app/management/kibana/indexPatterns
Create Index patterns. Here the Index Pattern is pihole-logstash-*
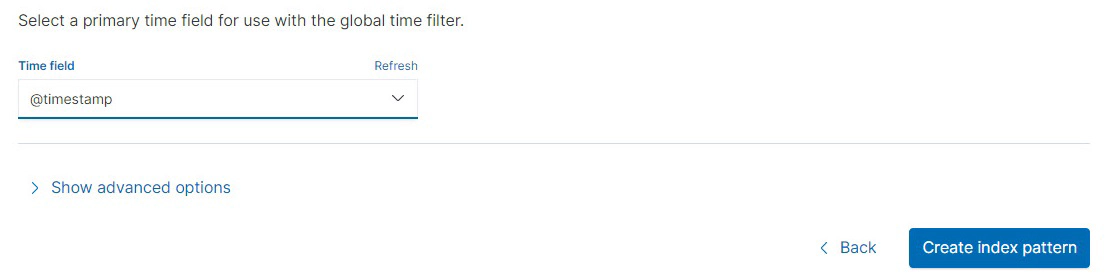
Select @timestamp as Time field
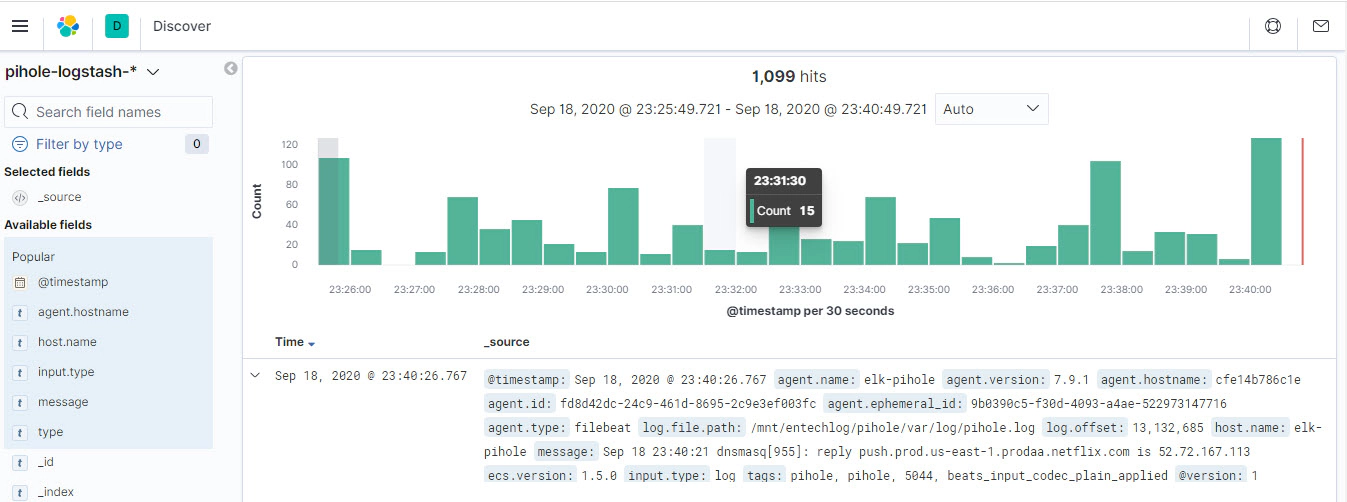
Step 4: Navigate to Kibana http://entechlog-vm-01:5601/app/discover to view the logs.
ksqlDB is built on top of Kafka Streams, a lightweight, powerful Java library for enriching, transforming, and …

In this article, we will see how to generate test data for Kafka using Faker. We could also generate test data using …