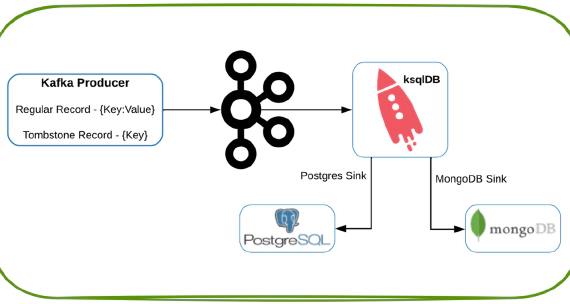
Exploring Kafka tombstone records in ksqlDB, MongoDB and Postgres
In this article, we will see how to generate a tombstone record in Kafka and to observe the behavior in ksqlDB, MongoDB …


In this article, we will see how to install Confluent Kafka using Ansible and to monitor the metrics using Prometheus and Grafana. Code used in this article can be found in GitHub
Download and install Ansible for your platform in the client machine. See here for instructions on how to install Ansible
Download the Ansible playbook for Confluent platform from GitHub
Create a copy of hosts_example.yml as hosts_lab.yml and make changes to update host names specific to your environment
Here is the output of compare results from changes to hosts_example.yml. Pay attention to changes related to jmx and prometheus like, jmxexporter_enabled and ksql_custom_java_args
Compare Command: reset; sdiff -WBs -w $COLUMNS hosts_example.yml hosts_lab.yml > /tmp/compare.output.temp; sed -i '/^[[:space:]]*$/d;s/[[:space:]]*$//' /tmp/compare.output.temp
Edit roles\confluent.common\tasks\main.yml to add the following. Add it before the set_fact command. main.yml may not be the best place for these statements but it will work for this demo
- name: Create UDF directory
file:
	path: "{{ ksql_udf_path }}"
	state: directory
	mode: 0777

- name: Create javatmp directory
file:
	path: "{{ ksql_javatmp_path }}"
	state: directory
	mode: 0777

- name: Create ksql state directory
file:
	path: "{{ ksql_state_path }}"
	state: directory
	mode: 0777

- name: Create rocksdbtmp directory
file:
	path: "{{ ksql_rocksdbtmp_path }}"
	state: directory
	mode: 0777

- name: Create kafka data directory
file:
	path: "{{ ksql_kafka_data_path }}"
	state: directory
	mode: 0777
Now we are ready to run the playbook, If you are running this in a server which already confluent platform run below commands to remove old install and start fresh
# Get list of installed packages and remove it
sudo apt list --installed confluent* | cut -d, -f1 | xargs sudo apt --yes --purge remove

# Stop confluent services
sudo systemctl stop confluent*

# Disable confluent services
sudo systemctl disable confluent*

# Remove systemd directories
sudo rm -Rf /etc/systemd/system/confluent*

# Clean systemctl
sudo systemctl daemon-reload
sudo systemctl reset-failed

# Remove all old directories
sudo rm -Rf /etc/schema-registry/
sudo rm -Rf /etc/kafka/
sudo rm -Rf /etc/confluent-rebalancer/
sudo rm -Rf /etc/confluent-kafka-mqtt/
sudo rm -Rf /etc/confluent-control-center/
sudo rm -Rf /etc/ksql/

sudo rm -Rf /var/log/kafka/
sudo rm -Rf /var/log/confluent/
sudo rm -Rf /var/lib/confluent/
sudo rm -Rf /var/lib/kafka/
sudo rm -Rf /var/lib/kafka-streams/
sudo rm -Rf /var/lib/zookeeper/

sudo rm -Rf /tmp/control-center-logs/
sudo rm -Rf /usr/share/confluent-hub-components/

sudo rm -Rf /opt/confluent/javatmp/
sudo rm -Rf /opt/confluent/kafka/
sudo rm -Rf /opt/confluent/rocksdbtmp/
Create ssh key
ssh-keygen -t rsa
Validate the public key by copying it to authorized_keys in same machine and then issuing ssh <target-host-name>
cat /home/<user-name>/.ssh/id_rsa.pub > ~/.ssh/authorized_keys
ssh <target-host-name>
Copy the ssh key from client host with Ansible to target host on which we need to install Confluent.
cat /home/<user-name>/.ssh/id_rsa.pub | ssh <user-name>@<target-host-name> 'mkdir -p ~/.ssh && chmod 700 ~/.ssh && cat >> ~/.ssh/authorized_keys && chmod 600 ~/.ssh/authorized_keys'
Update /etc/sudoers in target host
Defaults:<user-name> !requiretty
<user-name> ALL=(ALL) NOPASSWD: ALL
Execute the playbook by running
ansible-playbook -i hosts_lab.yml all.yml
Here is some common errors and solutions when running this playbook
| Error | Solution |
|---|---|
| fatal: [entechlog-vm-01]: FAILED! => {“msg”: “Missing sudo password”} | ansible-playbook –ask-become-pass -i hosts_lab.yml all.yml |
| Jul 11 21:34:04 entechlog-vm-01 schema-registry-start[17870]: Caused by: io.confluent.kafka.schemaregistry.storage.exceptions.StoreException: Failed to write Noop record to kafka store. | Make sure to remove all old directories or start the services with a new service id |
| Jul 11 23:55:12 entechlog-vm-01 kafka-server-start[5411]: Caused by: java.net.BindException: Address already in use | Update ksql_custom_java_args to use a different port for prometheus, Running Docker and Jenkins on same machine may also cause Address already in use error |
http://<target-host-name>:29000/Create Prometheus system user and group
sudo groupadd --system prometheus
sudo useradd -s /sbin/nologin --system -g prometheus prometheus
Create data and config directories for Prometheus
sudo mkdir /var/lib/prometheus
for i in rules rules.d files_sd; do sudo mkdir -p /etc/prometheus/${i}; done
Download and Install Prometheus
sudo apt update
sudo apt -y install wget curl vim
mkdir -p /tmp/prometheus && cd /tmp/prometheus
curl -s https://api.github.com/repos/prometheus/prometheus/releases/latest | grep browser_download_url | grep linux-amd64 | cut -d '"' -f 4 | wget -qi -
tar xvf prometheus*.tar.gz
cd prometheus*/
sudo mv prometheus promtool /usr/local/bin/
Check installed version
prometheus --version
promtool --version
Create Prometheus configuration file
sudo mv prometheus.yml /etc/prometheus/prometheus.yml
sudo mv consoles/ console_libraries/ /etc/prometheus/
Update Prometheus configuration file with scrape_configs for ksqlDB
sudo nano /etc/prometheus/prometheus.yml
  # The job name is added as a label `job=<job_name>` to any timeseries scraped from this config.
  - job_name: 'ksqldb'

    # metrics_path defaults to '/metrics'
    # scheme defaults to 'http'.

    static_configs:
    - targets: ['entechlog-vm-01:29000']
If you want to locate the prometheus.yml later on, use the command ps -ef | grep prom | grep yml
Create Prometheus systemd service unit file
[Unit]
Description=Prometheus
Documentation=https://prometheus.io/docs/introduction/overview/
Wants=network-online.target
After=network-online.target

[Service]
Type=simple
User=prometheus
Group=prometheus
ExecReload=/bin/kill -HUP \$MAINPID
ExecStart=/usr/local/bin/prometheus \
  --config.file=/etc/prometheus/prometheus.yml \
  --storage.tsdb.path=/var/lib/prometheus \
  --web.console.templates=/etc/prometheus/consoles \
  --web.console.libraries=/etc/prometheus/console_libraries \
  --web.listen-address=0.0.0.0:9090 \
  --web.external-url=

SyslogIdentifier=prometheus
Restart=always

[Install]
WantedBy=multi-user.target
Update directory permissions
for i in rules rules.d files_sd; do sudo chown -R prometheus:prometheus /etc/prometheus/${i}; done
for i in rules rules.d files_sd; do sudo chmod -R 775 /etc/prometheus/${i}; done
sudo chown -R prometheus:prometheus /var/lib/prometheus/
Reload systemd daemon and start the service
sudo systemctl daemon-reload
sudo systemctl start prometheus
sudo systemctl enable prometheus
sudo systemctl status prometheus
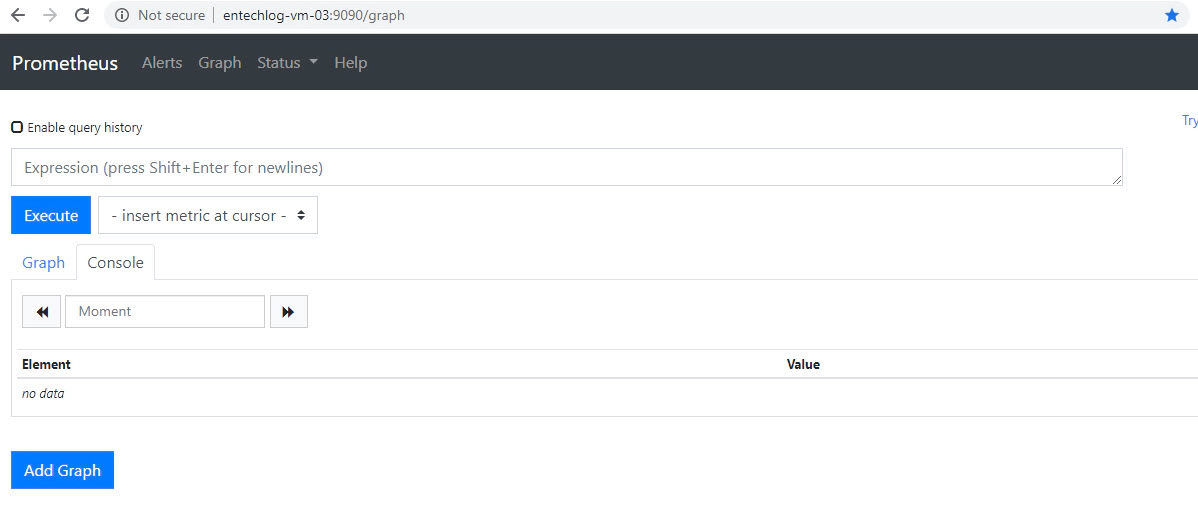
Prometheus comes up in port 9090, Validate by navigating to http://<target-host-name>:9090/
Install and configure Grafana, See here for the instructions.
Prometheus comes up in port 3000, Validate by navigating to http://<target-host-name>:3000/. The default user name and password is admin/admin.
Add a new datasource and name it as Prometheus-ksqlDB.
URL to http://<target-host-name>:9090/HTTP Method to GETSave and Test the Data Sources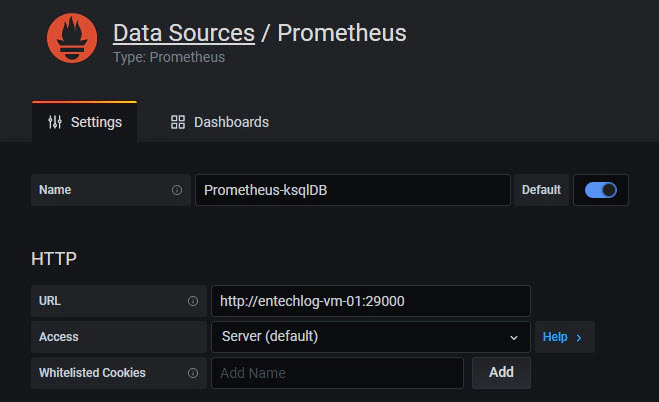
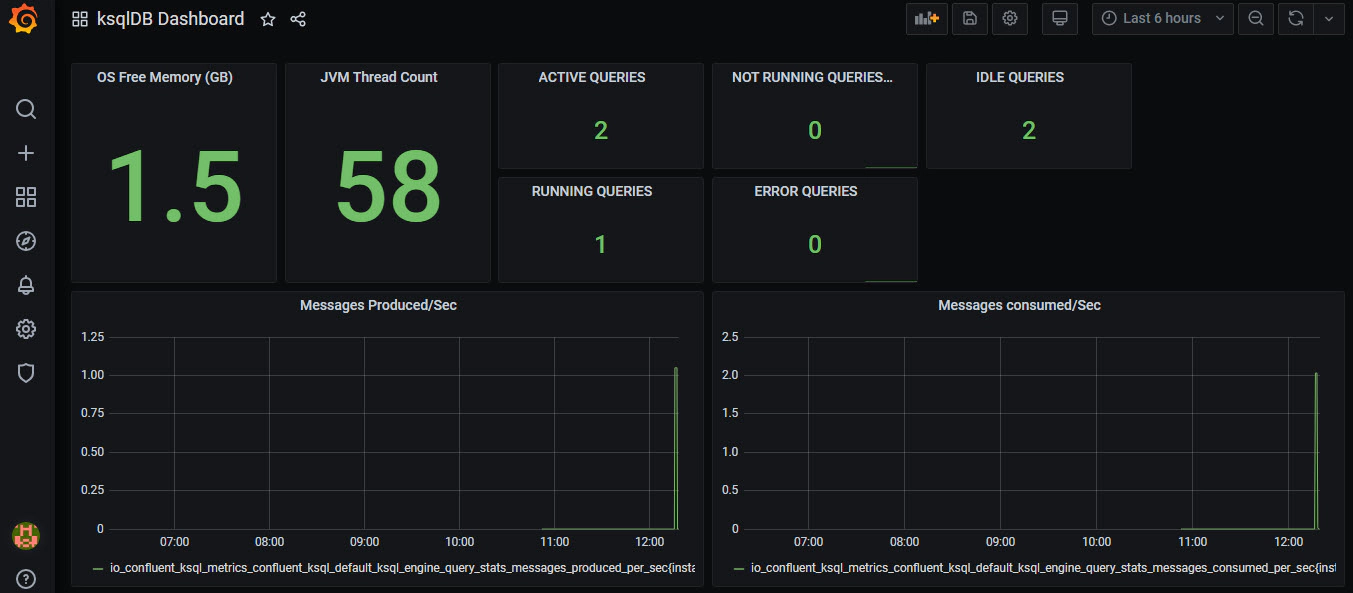
Create a new Dashboard, Add the required Panels and Metrics like the one shown below.
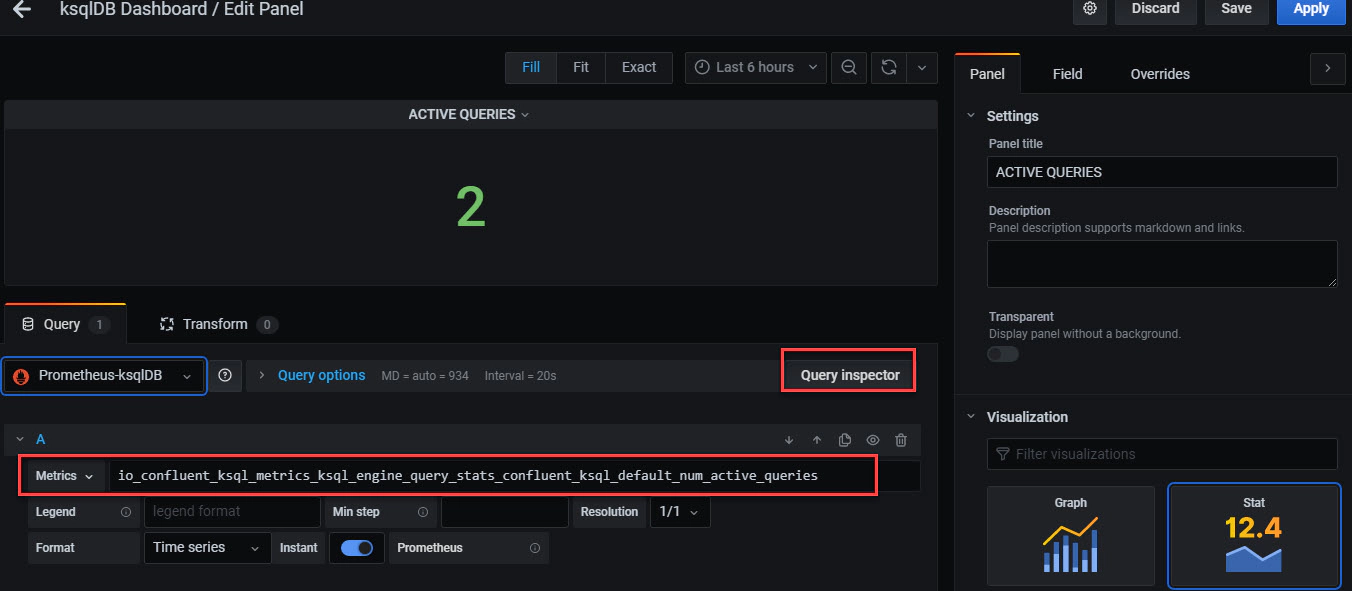
Once you have all the required metrics added, You can visualize the dashboard like the one shown below.
In this article, we will see how to generate a tombstone record in Kafka and to observe the behavior in ksqlDB, MongoDB …

ksql-test-runner is a ksqlDB testing tool to test set of KSQL statements. In this article, we will see how to use …